Webserver Performance Problems
I’ve been having problems with the webserver that KiwiWeather.com runs on, with it typically taking about 8-10 seconds for the first page to load, but then reasonable performance as you navigate around the site.
As always with IT, it is much, much easier to troubleshoot when something is broken and you’ve got some awesome error messages that really detail exactly what is wrong. This means that you can paste the error into your favourite search engine, find where someone else hit the problem plus found the solution and then it is a case of following the recipe on fixing it.
But performance problems are not as easy as everything is working, just not working as fast as it should.
I’m running the site on an old desktop PC which will be close to 10 years old as it is running an Intel i7-3770 CPU which launched in 2012. The only thing I’ve done to enhance it was to boost the RAM from 8GB to 24GB. It is running Proxmox as a hypervisor and it has multiple VMs which do everything from processing satellite images and creating videos to hosting the webserver.
First off, I noticed that the VM which was creating the videos was doing a lot of work, which helped contribute to the overall workload across both CPU usage and disk I/O. So to assist this I dropped the frequency at which the videos were created. However this didn’t seem to make much overall difference, although it will have somewhat helped.
Then I realised that I’d well and truly over provisioned CPU cores to the different VMs. I’d previously added a few more CPU cores to the more performance critical VMs, which seemed to help them, but I’d not spotted that it made the overall problem worse.
Who would have thought that a CPU with 4 cores, each capable of two threads (effectively 8 virtual CPU cores) would have struggled when I’d provisioned 24 cores across the VMs. So I worked through each VM, seeing how many CPU cores it really needed and reduced down to just 9 against the actual 8, which helped.
Next I spent a lot of time reading everything I could about troubleshooting webserver performance, but again nothing really helped.
I tried a few other things, like using ionice, which can make Linux code run “nicely”. One big impact was with the backing up of data from VMs to PC. This was implemented using Python and it was running with Popen from the subprocess library.
I’d found that the “magic” for getting rsync to work nice was to add as arguments the following, which would make it only work when everything else was essentially “idle”.
--rsync-path "ionice -c 3 nice rsync"Try as I might, I couldn’t get this to work at all, no matter what I did (pulling hair out didn’t work). Until I found a forum post which also had someone trying to do the same and it not working. But I loved their workaround, which was to write a shell script which ran rsync with the “magic” arguments.
I got this working and it made a bit of an impact when I was doing the regular backups, but again it didn’t fix the overall problems.
Everything I was trying made a bit of a difference, but I knew I hadn’t found the real problem so I could get the performance back to where it was.
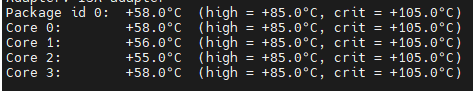
More time to think of what to look for, without success, until I was looking at the different info available on Proxmox when I clicked syslog. Then something clicked as it showed the CPU was thermally throttling as it was sensing that the CPU was getting a bit too hot, so it was dropping the CPU core frequency to reduce the heat. It was bouncing between 85C which was where it considered it was a bit too hot and around 105C which is near the critical temperature. This looked like a smoking gun, although the on chip thermal protection was doing a great job to stop it from literally smoking.
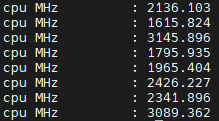
I found a forum which covered an application which showed how to find the frequency each of the CPU cores were running at. I’d looked this up as on a warm, late summer evening the problem seemed to be a lot worse than normal.
cat /proc/cpuinfo | grep MHz
I wish I’d captured the output, but it showed all of the cores were bouncing between about 1.6GHz when throttled to about 2.5GHz until the temperature built up again, then repeating the cycle.
I then found an applications, sensors, via a useful webpage. This was rapidly installed and I saw that the temperature measurements matched what was in the Proxmox syslog.
No doubt it being a pretty warm evening was a contributor to the CPU temperature being so high, but it wasn’t everything. So I shut down all the VMs, powered the system down and opened it up. Everything looked pretty normal, apart from a load of dust and fluff on the fans. From experience it is easier to clean them when the CPU fan is out of the case as otherwise the dust just moves elsewhere in the case.
Then on removing the CPU cooler, I saw the real smoking gun. The thermal paste looked rock solid and instead of covering the CPU to get good thermal conduction, it was the size of a small pea.
After cleaning everything up and repasting the CPU, I put everything back together and powered up the system, hoping it really was the fix. First place I looked was the syslog in Proxmox and all the messages warning about the temperatures had gone. Next was to look at the core frequencies and temperatures.
The site performance is now significantly improved and over the last two days, I’d seen the temperatures drop as low as the mid-40s first thing in the morning, with them rising as it gets warmer through the day.
So for now, at least, I can devote my time to something other than finding a performance problem.