MeteorDemod Tutorial for Meteor M-2
How to make amazing Meteor M-2 weather satellite images using the MeteorDemod software.
Introduction
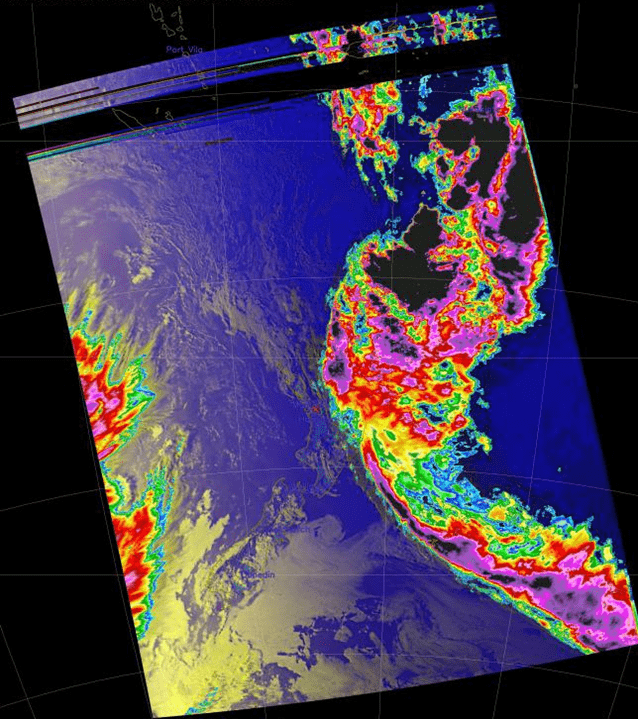
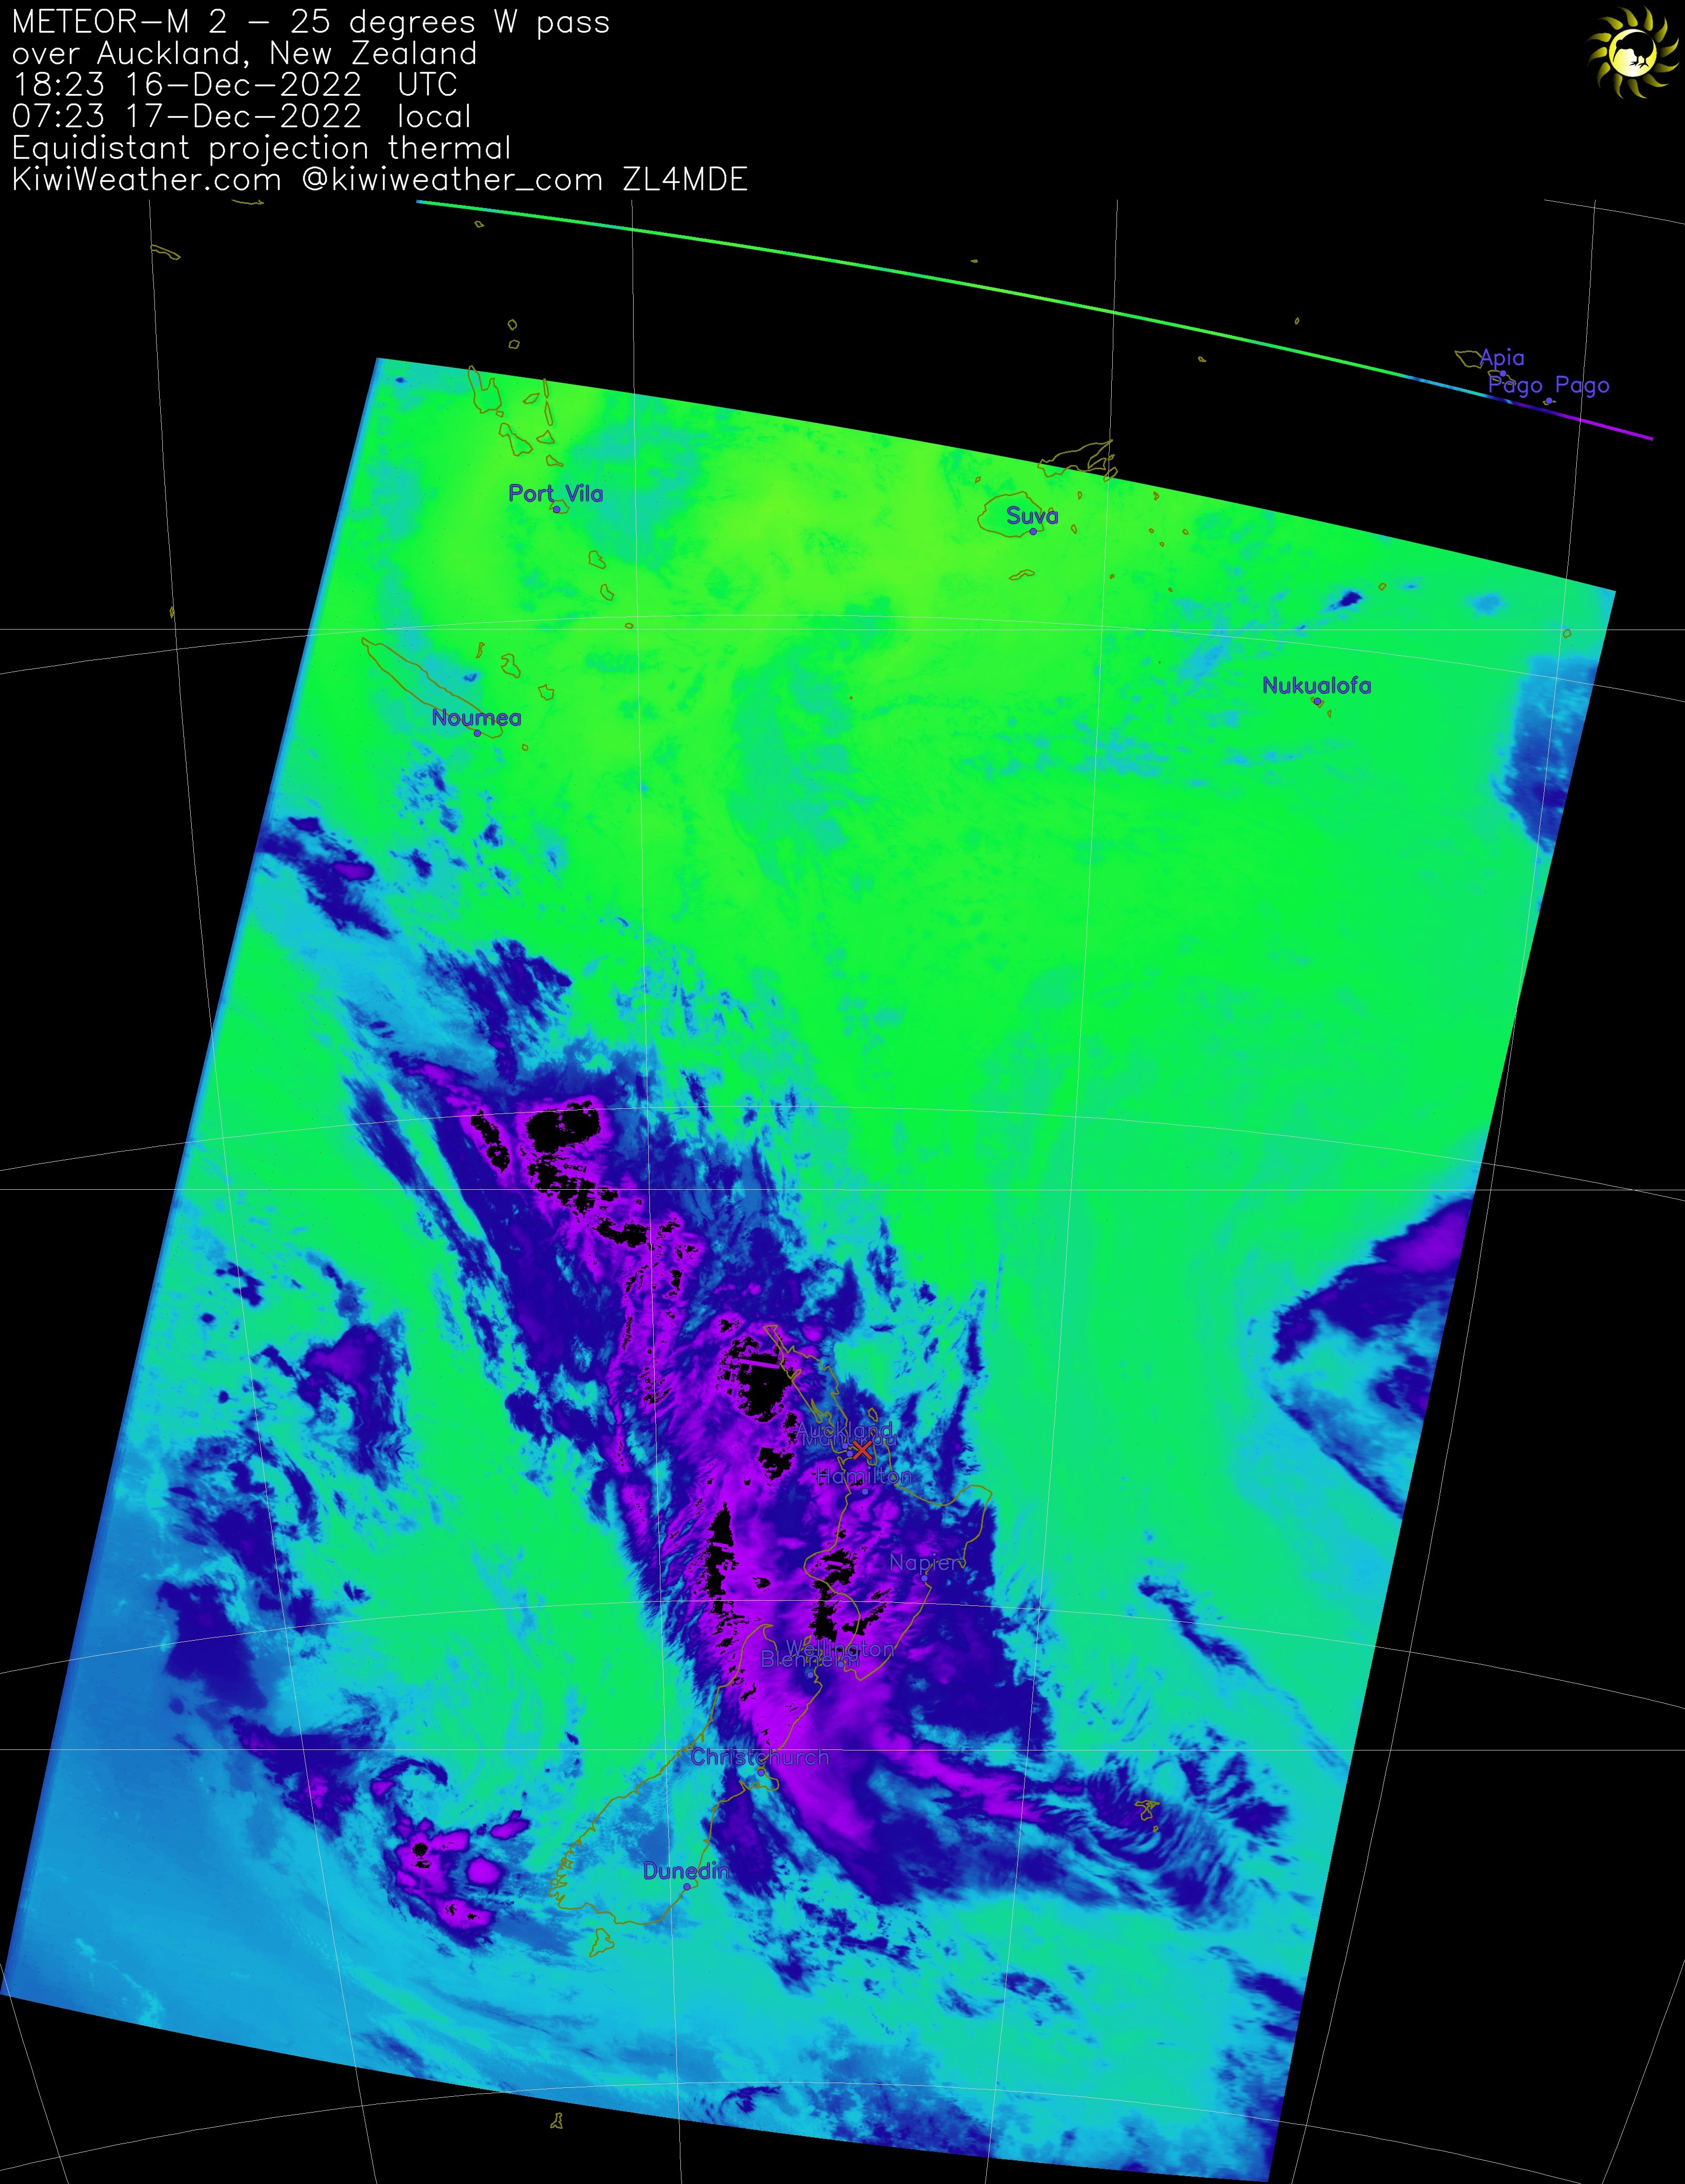
MeteorDemod is a software application which will take .wav files from the Meteor M-2 weather satellites, along with a .tle file and create amazing images. With the example below being one of the images captured showing an incredible weather front that passed over New Zealand in December 2022.
So, like I did, I saw similar images being posted on Reddit and Twitter and decided that I’d like to get this working too. I hit a few issues along the way, which is why I decided to write this guide to getting started.
The application will work on Linux and Windows, however since I use a Raspberry Pi for my NOAA / Meteor processing I went the Linux route. Although the vast majority of this guide will apply to Windows too.
I’ll also cheat slightly. Whilst the Raspberry Pi is an incredible solution, the processing power doesn’t match that of a modern desktop. So, I’ve written this guide using a Debian Virtual Machine (VM) using Oracle’s Virtual Box software. This allows me and will also allow you to rapidly home in on how you want to configure MeteorDemod for when you install it on a Raspberry Pi.
Oracle VirtualBox Installation
Oracle’s VirtualBox is a virtualization solution which allows you to run VMs (Virtual Machines) on top of your normal operating system. This is great for experimentation with new software and for running Linux applications on a Windows desktop. It can do so much more, but that could be a whole series of articles in its own right.
First off, we need to download VirtualBox:
You’ll need to pick the version which works for your main operating system, which for most will be Windows, so use the “Windows hosts” link. This will kick off the download.
Installing it is just like virtually any other application, so I won’t go into that in detail as it is pretty much just clicking next, next, etc.
You will need to enable virtualization in your PC’s BIOS and how you do this will be dependent on the motherboard and BIOS you have. There are extensive guides available and a load of videos on sites like YouTube:
Setting Up a VM
For this, I’ll use the current latest version of Debian, primarily as it is pretty close to Raspberry Pi OS.
First off, kick off downloading Debian as depending on the speed of your internet connection, this could take a while.
From the “Small CDs or USB sticks” section, pick the architecture you’re using, which for anyone with a modern Windows PC, both AMD or Intel, and a 64 bit OS will be the am64 link. This took about 30 seconds on a gigabit fibre connection for the 391MB file (at the time of writing).
This guide was written for the following version. However the guide is probably unchanged for most versions of Debian (note – I’ve not tried it on all other possible versions!).
- debian-11.5.0-amd64-netinst.iso
I won’t go into the details of creating the VM as there are a large number of articles and videos online:
For the settings to use for the number of CPUs, RAM, etc., this will depend on how powerful your PC is. Remember that a Pi 4 only has a 4 core CPU, slow storage on maybe a 16GB SD card and maybe 4MB of RAM, so even using these settings on a PC will be faster even if you’re using a spinning hard drive for storage.
For my experimentation, I’ve been using the following:
- 8GB (8192MB) RAM – although this is overkill and 4GB will work fine
- 8 CPU cores – again overkill, 4 will be fine
- 30GB storage – although I’m only using just over 12GB, so you can cut back on this if you’re short of space
Whilst it will work using a spinning hard drive, you’ll see significant speed increases if you install onto an SSD or even better, onto an NVMe drive.
For just about everything else, I took the defaults, other than setting up things like my location (New Zealand), keyboard language, etc.
The whole process takes a few minutes, although I’ve done this multiple times, but if this is new to you then take your time and I’d suggest watching one of the many YouTube videos to guide you.
You’ll also need to give your user the ability to use sudo. Again there are multiple guides on this online:
(I’m trying to avoid turning this guide into a Linux sysadmin guide!).
From now, I’ll assume that you’ve got Debian up and running in a VM.
Installing MeteorDemod
I’ll be following the instructions in the MeteorDemod readme.md:
Note that there may be slight differences between what I’ve written in this guide if the readme.md is updated. I’ve used the version as of the 17th December 2022.
Whilst there is a Debian package for Raspberry Pi users, I’ll take the option of building and installing it from sources as this is a more generic approach.
You can do the installation using the graphical user interface and opening a terminal window, although my preference is to use MobaXterm (https://mobaxterm.mobatek.net/download-home-edition.html). If doing this, you’ll need to install open-sshserver:
sudo apt-get install openssh-serverNext is basically following the instructions as written, starting off with dependencies:
sudo apt install python3-dev python3-pip -y

sudo apt install cmake build-essential pkg-config git -y

sudo apt install libatlas-base-dev liblapacke-dev gfortran -y

sudo apt install libopencv-dev python3-opencv -y
Now we can install MeteorDemod:
git clone --depth=1 https://github.com/Digitelektro/MeteorDemod.git

cd MeteorDemod

git submodule update --init --recursive

mkdir build && cd build

cmake ../

make -j4

sudo make install
If you see errors during this process, things to check:
- Did you install ALL of the dependencies? If in doubt, reinstall them again and ensure you didn’t miss any
- Did you miss any steps? Easy to do (I did this the first time I tried it!)
You should now have MeteorDemod installed, with a quick way to check being:
meteordemod –helpYou should get some output which includes the MeteorDemod version number and the command line arguments supported. If so, you’re good to continue.
If you don’t, review the installation instructions and check that you didn’t miss anything plus review any error messages as this will give you a good clue as to where you went wrong.
Configuring settings.ini
The settings.ini file is located in the following location for Linux (it’ll be slightly different if you’re using Windows and not Linux):
~/.config/meteordemod/settings.iniTo set it up, you’ll need to edit it with a text editor.
This file, at the time of writing, is owned by the root user, not your local user. So you will need to use sudo when editing it.
First off, I’d take a copy of this file, in case you mess things up and want to return to the original.
sudo cp /home/mike/.config/meteordemod/settings.ini /home/mike/.config/meteordemod/settings.ini.ORIGThe above is all one line, not two!
Then editing it, with nano:
sudo nano /home/mike/.config/meteordemod/settings.iniWhen changing values, I’d strongly suggest not trying to change everything at once. Instead make one or two changes, run MeteorDemod to see the results, then repeat the process.
If a line starts with a #, this is a comment line, so it is well worth adding comments around what you’ve changed and the original values so that you can easily undo your changes.
Looking through the file, you’ll see it broken down into sections, with each section heading being identified with a [ at the start of the line and a ] at the end.
So going through the different sections, I’ll show what I’ve personally changed or you may wish to change.
A common set up is to turn a feature on (value is true) or off (value is false).
[Program]
- AzimuthalEquidistantProjection=true
- Keep as is or set to false to turn off generating images with this projection
- I keep this as is
- MercatorProjection=true
- Keep as is or set to false to turn off generating images with this projection
- I keep this as is
- SpreadImage=true
- Keep as is or set to false to turn off
- This will correct the standard Meteor image which distorts the edges
- I keep this as is
- AddRainOverlay=true
- Keep as is or set to false to turn off
- This will enhance the images by adding an overlay showing where rain is likely
- I keep this as is
- JpgQuality=100
- Keep as is or set to a lower value in the range 1 to 100
- Dropping the value will make the images significantly smaller, but will also drop the image quality
- I reduce this to 90 to balance disk space used with image quality
- ScanAngleM2=110.8
- Keep this as is
- RollM2=-2.9
- Keep this as is
- PitchM2=0.3
- Keep this as is
- YawM2=0
- Keep this as is
- # Onboard time offset in seconds
- TimeOffsetM2=0
- Keep this as is
- NightPassTreshold=20.0
- Threshold for determining if a pass is night or day for selecting which images to create
- Keep this as is
- # Scale output image, it helps to reduce memory usage and generates smaller images
- ProjectionScale=0.75
- Keep this as is
- May need to reduce this if doing multi-pass composites and using limited memory, e.g. a Pi 4 with less than 8GB of RAM
- CompositeProjectionScale=0.7
- Keep this as is
- CompositeAzimuthalEquidistantProjection=true
- Keep as is or set to false to turn off generating composite images with this projection
- I keep this as is (until issues #58 and #59 are resolved, but if you’re nowhere near the international date line then I’d turn these on)
- CompositeMercatorProjection=false
- Keep as is or set to false to turn off generating composite images with this projection
- I keep this as is (until issues #58 and #59 are resolved, but if you’re nowhere near the international date line then I’d turn these on)
- GenerateComposite123=true
- Keep as is or set to false to turn off generating composite images with this projection
- I keep this as is (until issues #58 and #59 are resolved, but if you’re nowhere near the international date line then I’d turn these on)
- GenerateComposite125=true
- Keep as is or set to false to turn off generating composite images with this projection
- I keep this as is (until issues #58 and #59 are resolved, but if you’re nowhere near the international date line then I’d turn these on)
- GenerateComposite221=true
- Keep as is or set to false to turn off generating composite images with this projection
- I keep this as is (until issues #58 and #59 are resolved, but if you’re nowhere near the international date line then I’d turn these on)
- GenerateComposite68=true
- Keep as is or set to false to turn off generating composite images with this projection
- I keep this as is (until issues #58 and #59 are resolved, but if you’re nowhere near the international date line then I’d turn these on)
- GenerateCompositeThermal=true
- Keep as is or set to false to turn off generating composite images with this projection
- I keep this as is (until issues #58 and #59 are resolved, but if you’re nowhere near the international date line then I’d turn these on)
- GenerateComposite68Rain=true
- Keep as is or set to false to turn off generating composite images with this projection
- I keep this as is (until issues #58 and #59 are resolved, but if you’re nowhere near the international date line then I’d turn these on)
[Demodulator]
- ;Increasing bandwidth allow the pll to lock faster on signal, while decreasing it makes the pll lock more stable
- CostasBandwidth=30
- If you’re having issues with the demodulator locking onto the image, you can increase this to see if it helps
- I keep this as is
- ;Increasing RRC filter order makes the filtering more accurate at the expense of speed
- RRCFilterOrder=32
- I keep this as is
- ;Waiting for lock makes smaller .S files and helps to discard the imperfect part of the image at the begining of decoding
- WaitForLock=1
- I keep this as is
[Treatment]
- FillBlackLines=true
- I keep this as is
[Watermark]
- ;Place options: top_left, top_center, top_right, bottom_left, bottom_center, bottom_right
- Place=top_center
- This controls where the image information is added
- I keep this as is
- Color=#AD880C
- This sets the colour of the text
- I keep this as is
- #Font height in pixels
- Size=80
- This sets the font size
- I keep this as is
- # Font line width in pixels
- Width=3
- This sets the font width
- I keep this as is
- ;Text options: use ‘%date%’ for date, ‘\n’ for new line
- Text=MeteorDemod by Digitelektro\nMETEOR M2\n%date%
- This is the text used in the overlay text, with the actual date replacing the %date%
- Note the use of \n to push the following text onto a new line
- If you want no overlay text, you can just remove all content after the =, i.e.:
- Text=
[ReceiverLocation]
- ; location should be -36.920, -174.8 (ish)
- Draw=true
- Set to false if you don’t want the location of your receiver shown
- Latitude=35.0095
- Change to match your latitude
- Latitude: North positive, South negative
- Easy to find using Google Maps or a GPS, but no need to be super accurate
- Longitude=-37.9893
- Change to match your longitude
- Longitude: East positive, West negative
- Easy to find using Google Maps or a GPS, but no need to be super accurate
- Color=#CC3030
- The colour of the mark
- I keep this as is
- Size=30
- The size of the mark
- I keep this as is
- Thickness=6
- The thickness of the mark
- I keep this as is
- ;MarkType options: STAR, CROSS, SQUARE, DIAMOND, TRIANGLE_UP, TRIANGLE_DOWN, TILTED_CROSS
- MarkType=TILTED_CROSS
- The style of the mark
- I keep this as is
[ShapeFileGraticules]
- FileName=ShapeFiles/ne_110m_graticules_10.shp
- Which graticules to use from the mapping data
- The mapping data is stored in ~/.config/meteordemod/ (will be different for Windows), with this applying to the other files below
- I keep this as is
- Color=#C8C8C8
- Graticule colour
- I keep this as is
- Thickness=1
- Graticule thickness
- I keep this as is
[ShapeFileCoastLines]
- FileName=ShapeFiles/ne_50m_coastline.shp
- Which coastlines to use from the mapping data
- I keep this as is
- Color=#808000
- Coastline colour
- I keep this as is
- Thickness=2
- Coastline thickness
- I keep this as is
[ShapeFileBoundaryLines]
- FileName=ShapeFiles/ne_50m_admin_0_boundary_lines_land.shp
- Which boundary lines to use from the mapping data
- I keep this as is
- Color=#C8C8C8
- Boundary line colour
- I keep this as is
- Thickness=2
- Boundary thickness
- I keep this as is
[ShapeFilePopulatedPlaces]
- FileName=ShapeFiles/ne_50m_populated_places.shp
- Which populated data to use from the mapping data
- I keep this as is
- Color=#5A42F5
- Colour for the marker for populated places
- I keep this as is
- #Font height in pixels
- Size=40
- Size of the marker
- I keep this as is
- # Font line width in pixels
- Width=2
- Width of the font
- I keep this as is
- PointRadius=10
- Radius of the point
- I keep this as is
- FilterColumnName=ADM0CAP
- Column to filter on from the mapping data
- ADM0CAP is the one for the capital city for each country
- I changed this to POP_MIN to filter on the minimum population as there are not too many capital cities around New Zealand and Australia, but if capturing somewhere like Europe I’d keep this as is
- NumericFilter=1
- Filter to use
- For ADM0CAP, keep this value as is
- If using POP_MIN then this is the minimum population size for a place to get a label
- I’m using 10000, i.e. ten thousand, which works well for New Zealand and Australia, but if capturing somewhere like Europe I’d keep this a lot higher to avoid too many labels on your image
- TextColumnName=NAME
- Text column to use for the labels
- This is the mapping column name to use from the data file
- I’d keep this as is, but if you want to change this, then you can load the mapping data into Excel and you’ll see the full set of available columns
Using MeteorDemod
Having set up our settings.ini file, or more likely having made a few minor changes and wanting to experiment with it, we need to have:
- A .wav file from a Meteor pass
- How you get this will depend on the exact method you’re using to capture passes and I’m avoiding writing a guide for every possible solution here
- A .tle file which includes the Meteor data
- As per the .wav file, how you get this will depend on the exact method you’re using to capture passes and I’m avoiding writing a guide for every possible solution here
I’m using examples from a pass I captured this morning, Saturday 17th December over New Zealand:
- 2022-12-16-18-23-10-METEOR-M_2.wav
- The exact filename doesn’t matter, but I’ve captured in the filename the date and time using UTC for the start of the pass
- 2022-12-16-18-23-10-METEOR-M_2weather.tle
- The exact filename doesn’t matter, but I’ve captured in the filename the date and time using UTC for the start of the pass
To kick off processing this data, the command I’m using is:
meteordemod -i 2022-12-16-16-42-46-METEOR-M_2.wav -t 2022-12-16-16-42-46-METEOR-M_2weather.tle -f jpg -d 16-12-2022Note the use of the arguments:
- -i
- This is the input file, i.e. my .wav file
- -t
- This is my .tle file
- -f
- What format I want the output images to be
- -d
- This is the UTC date that the data was captured on, for the start of the pass
- Note this may be different from your local date
Although if you look at the help information, there are other arguments which can be set, with the full set being:
- -h -or –help
- Print help
- -t or –tle
- TLE file required for pass calculation
- -I or –input
- Input S file containing softbits
Or
- Input .wav file
- -o or –output
- Output folder where generated files will be placed
- If not specified, the current folder where you’re running the command from will be used
- -d or –date
- Specify pass date, format should be dd-mm-yyyy
- -f or –format
- Output image format (bmp, jpg)bmp is not lossy, but uses a lot more disk space
- jpg is lossy, but uses a lot less disk space
- -s or –symbolrate
- Set symbol rate for demodulator
- Keep as is, but may need to change for future Meteor satellites
- -m or –mode
- Set demodulator mode to qpsk or oqpsk
- Keep as is, but may need to change for future Meteor satellites
- -diff
- Use differential decoding (Maybe required for newer satellites)
- Keep as is
- -int
- Deinterleave (Maybe required for newer satellites)
- Keep as is
- -b or –brokenM2
- Broken M2 modulation
- Keep as is, but may need to change for future Meteor satellites
As you can see, I’ve only used a few of the options.
Kicking this off, we will see output showing the progression through the following stages:
- Converting the .wav file to a .s file (unless the .s file was the input file)
- Note that the .s file is not removed after processing, so for future runs of processing the same file, I’d use the .s file instead of the .wav file to speed things up
- Although if you’re changing the values in the [Demodulator] section, you’ll need to reprocess the .wav file again
- Decoding packets
- Extracting each pass line from the .s file
- Generate images
- This part makes use of all available CPU cores to process in parallel
If you’ve specified in your settings.ini file that you want to create composite images, then the code will look at the timestamp of the .gcp files to see if there are any passes within 6 hours and will then use them for the composite generation.
Note that this is currently using the timestamp of the file and not the date / time in the filename (Issue #61).
Now for the output images, with the values set in settings.ini unchanged from their default, other than setting the receiver location for where I am in Auckland, New Zealand, we get the following files:
- 2022-12-16-18-28-14.gcp
- This contains coordinate information used for adding the mapping overlay
- Note the filename has the UTC date time for the pass with the time component being the start time for the start of the lines that were decoded and not the start time of the pass
- A set of .bmp files
- There is a file per decoded channel
- The filename has the UTC date time for the start of the decoded data, followed by the APID (data channel)
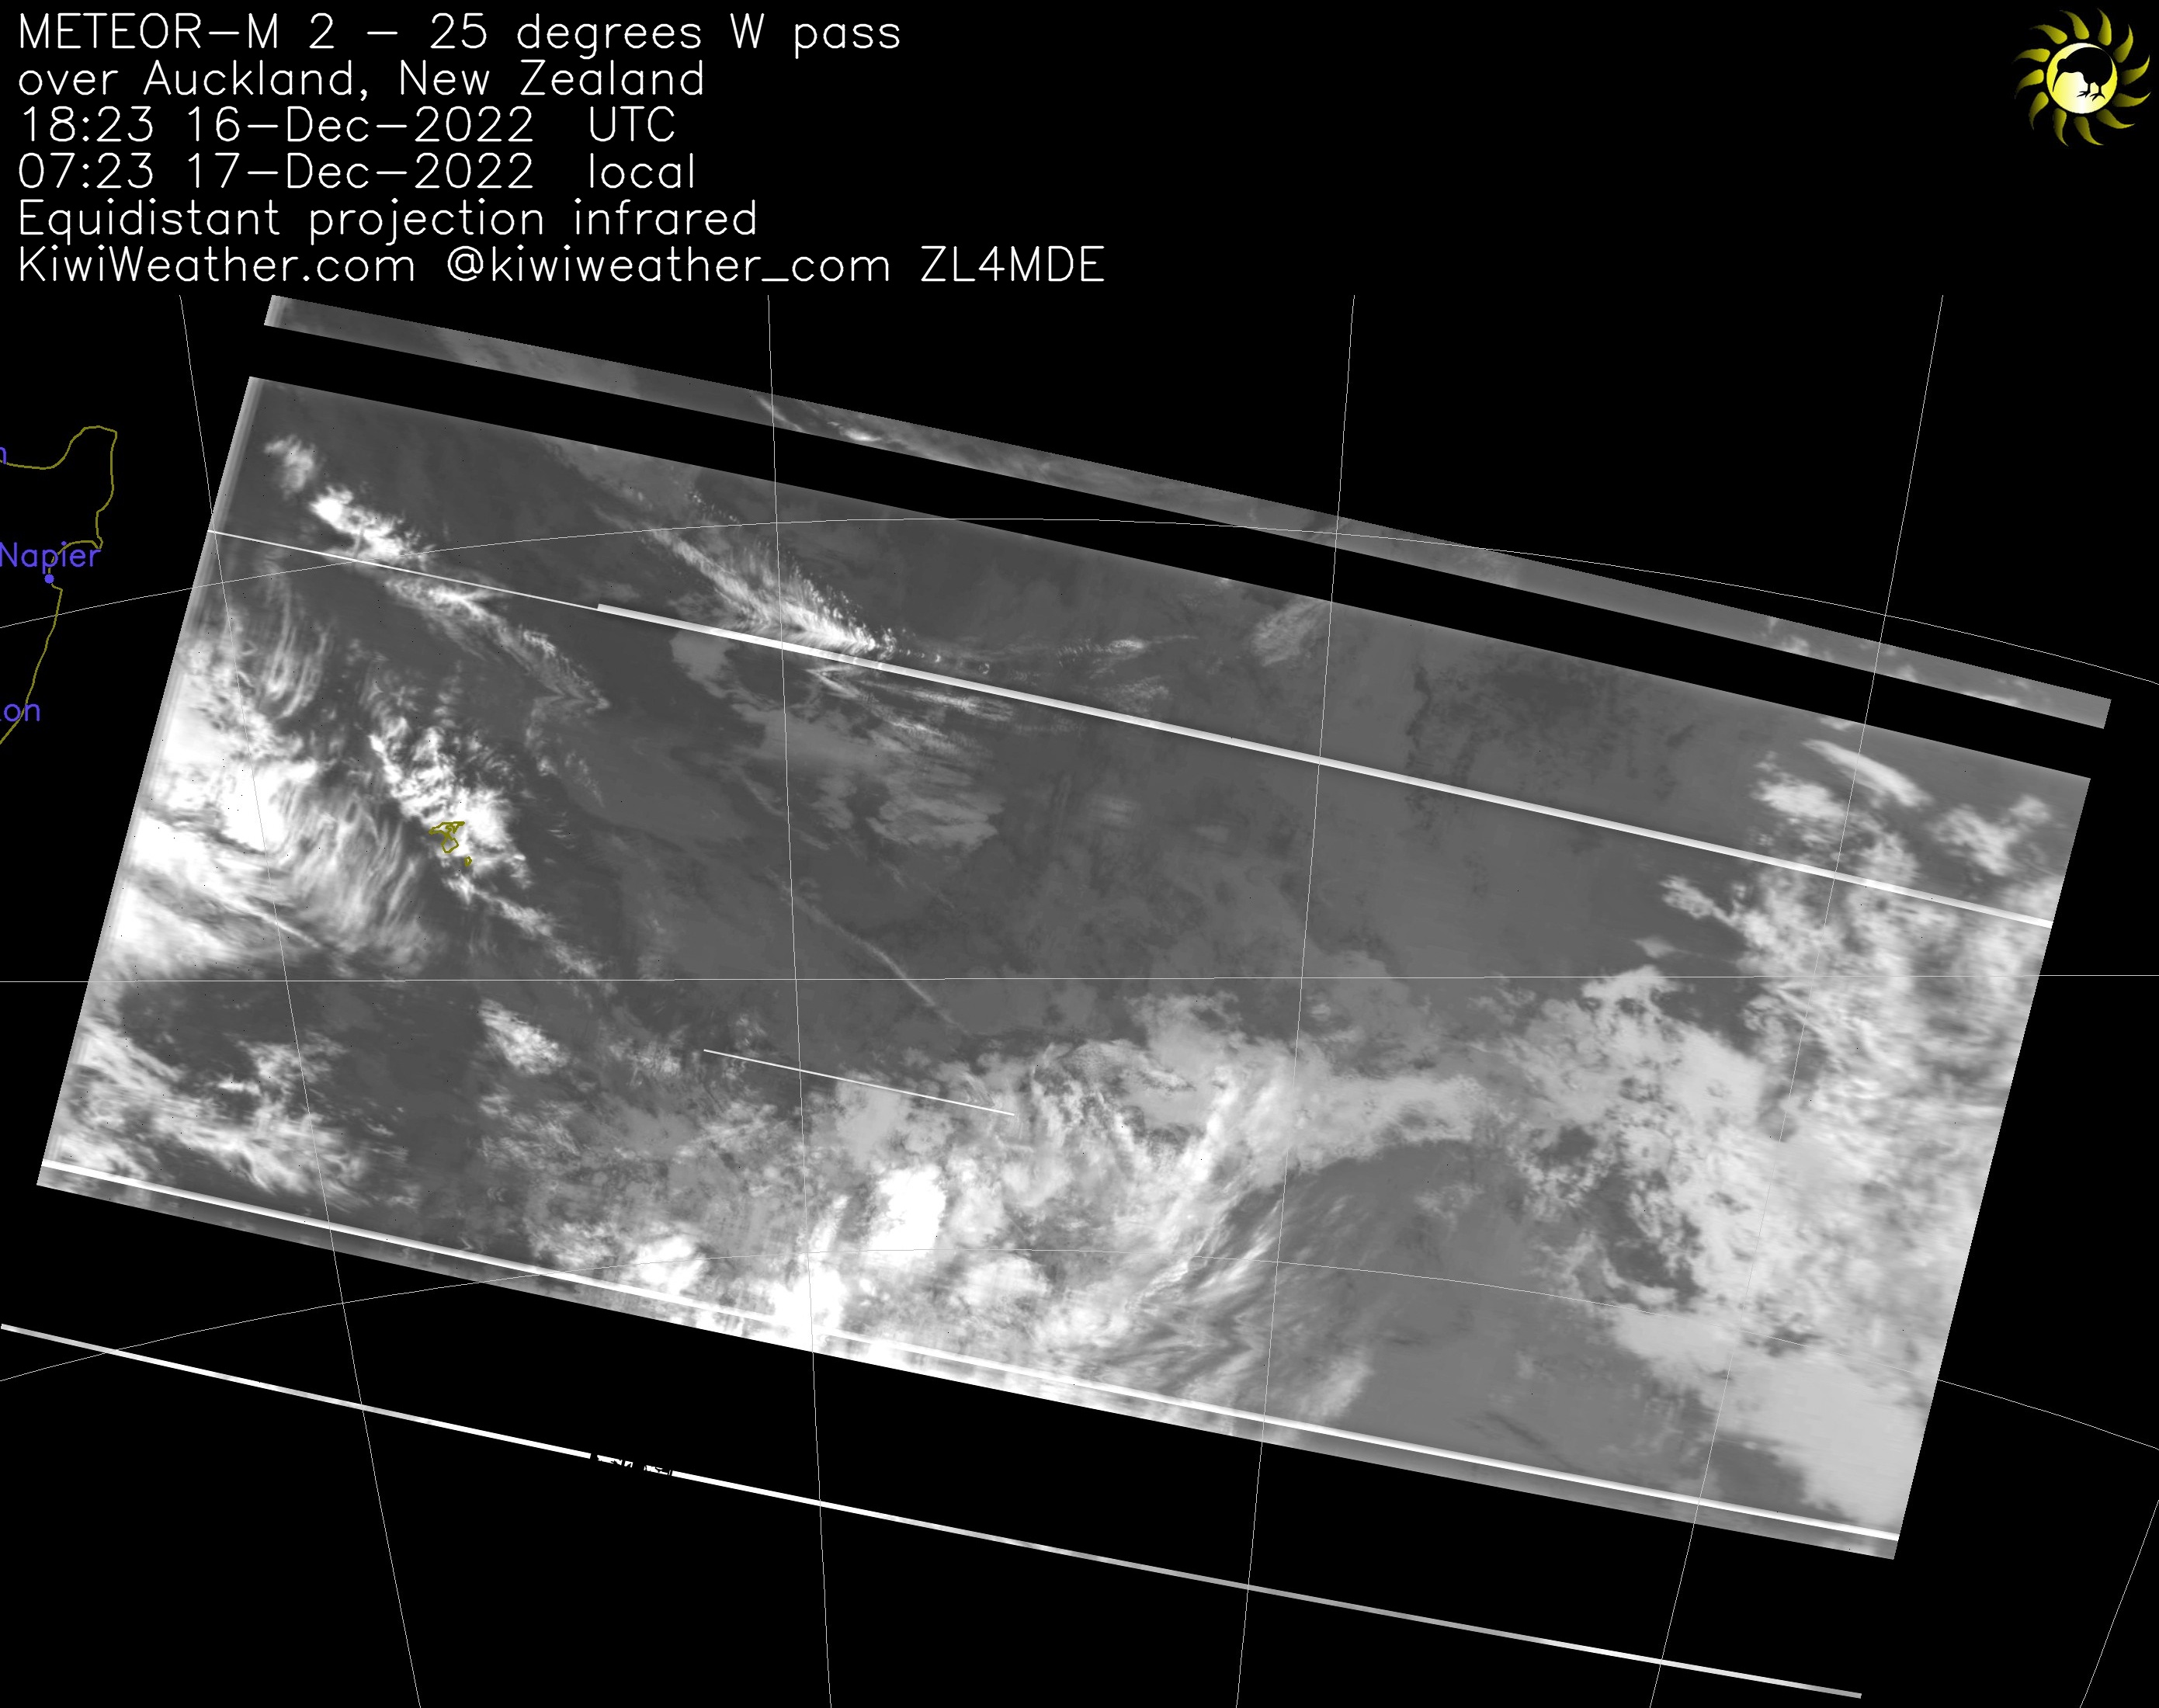
- There are 3 visible light channels and 3 infrared channels
- Which ones are in use can change
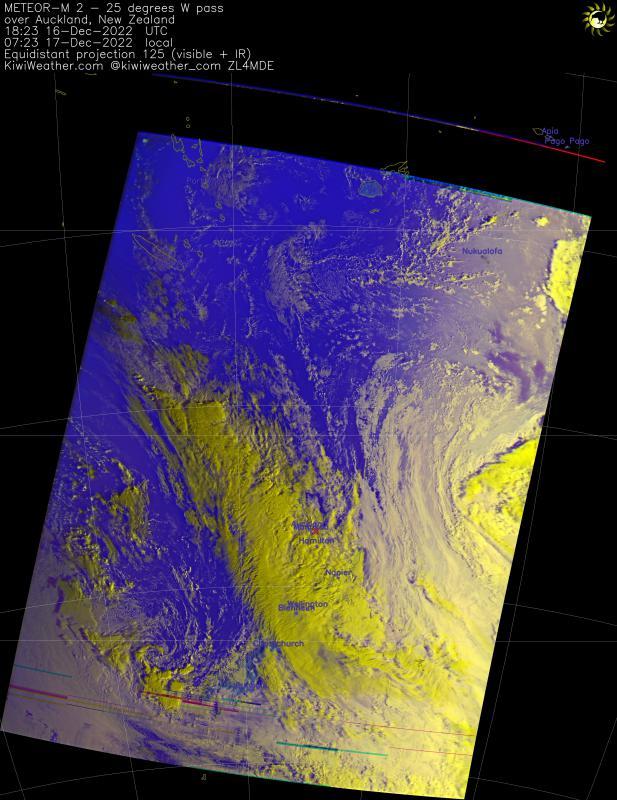
- There are also .bmp files with a combination of the different channels, e.g. 125 means using two visible channels and one of the IR channels
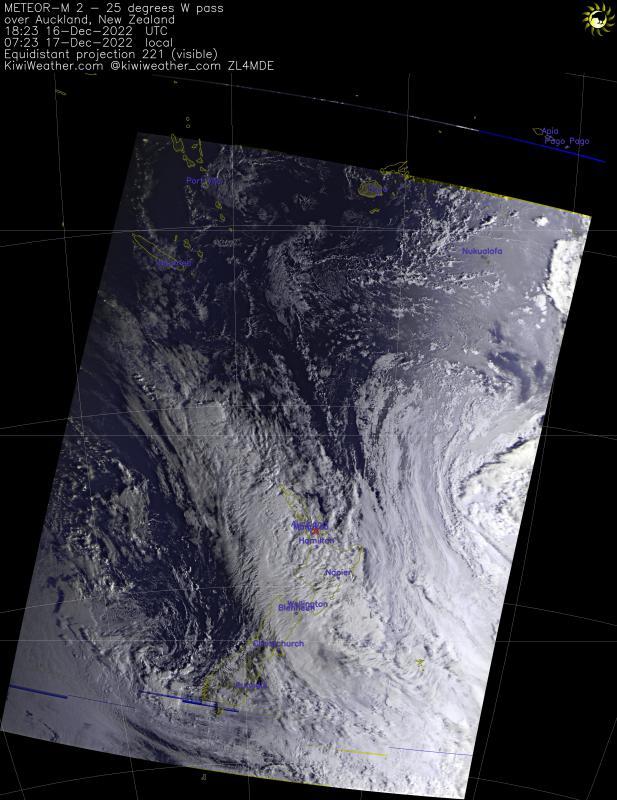
- A set of equidistant projection images
- A set of Mercator projections
Examples of the output are as below, although note that these contain a header that I’ve added and I didn’t generate the MeteorDemod watermark.
I’ve integrated MeteorDemod into my own software for capturing and processing weather satellite data, with the results available here on my website – https://kiwiweather.com/, with the polar satellites, NOAA 15 / 18 / 19 and Meteor M-2 being available in the Polar Orbiting section (https://kiwiweather.com/index.php/polar/polar-orbiting/).
The images are also Tweeted automatically to @kiwiweather.com (https://twitter.com/kiwiweather_com) and they are also sent to a selection of Discord servers.
